


Foto de Ian Murphy na Unsplash
Over the past few months, one concern has come up again and again in conversations across our ecosystem: what is the real risk that Artificial Intelligence poses to business models?
At moments of technological inflection, binary views are common. On one side, severe repricing of traditional software companies, with short-sighted narratives that go so far as to declare the premature death of the SaaS model. On the other, celebrations of the unprecedented pace of AI-native startups, which are already setting their sights on building a new scale of value and growth.
The reality on the front line, however, shows us that the dynamics of value creation and the risk of commoditization are structurally far more complex than this polarization suggests. As a firm that has followed the last few decades of innovation and technological cycles such as cloud and mobile, we understand that the history of tech cycles teaches us to look beyond the narratives, toward fundamentals that lead us to build mental models.
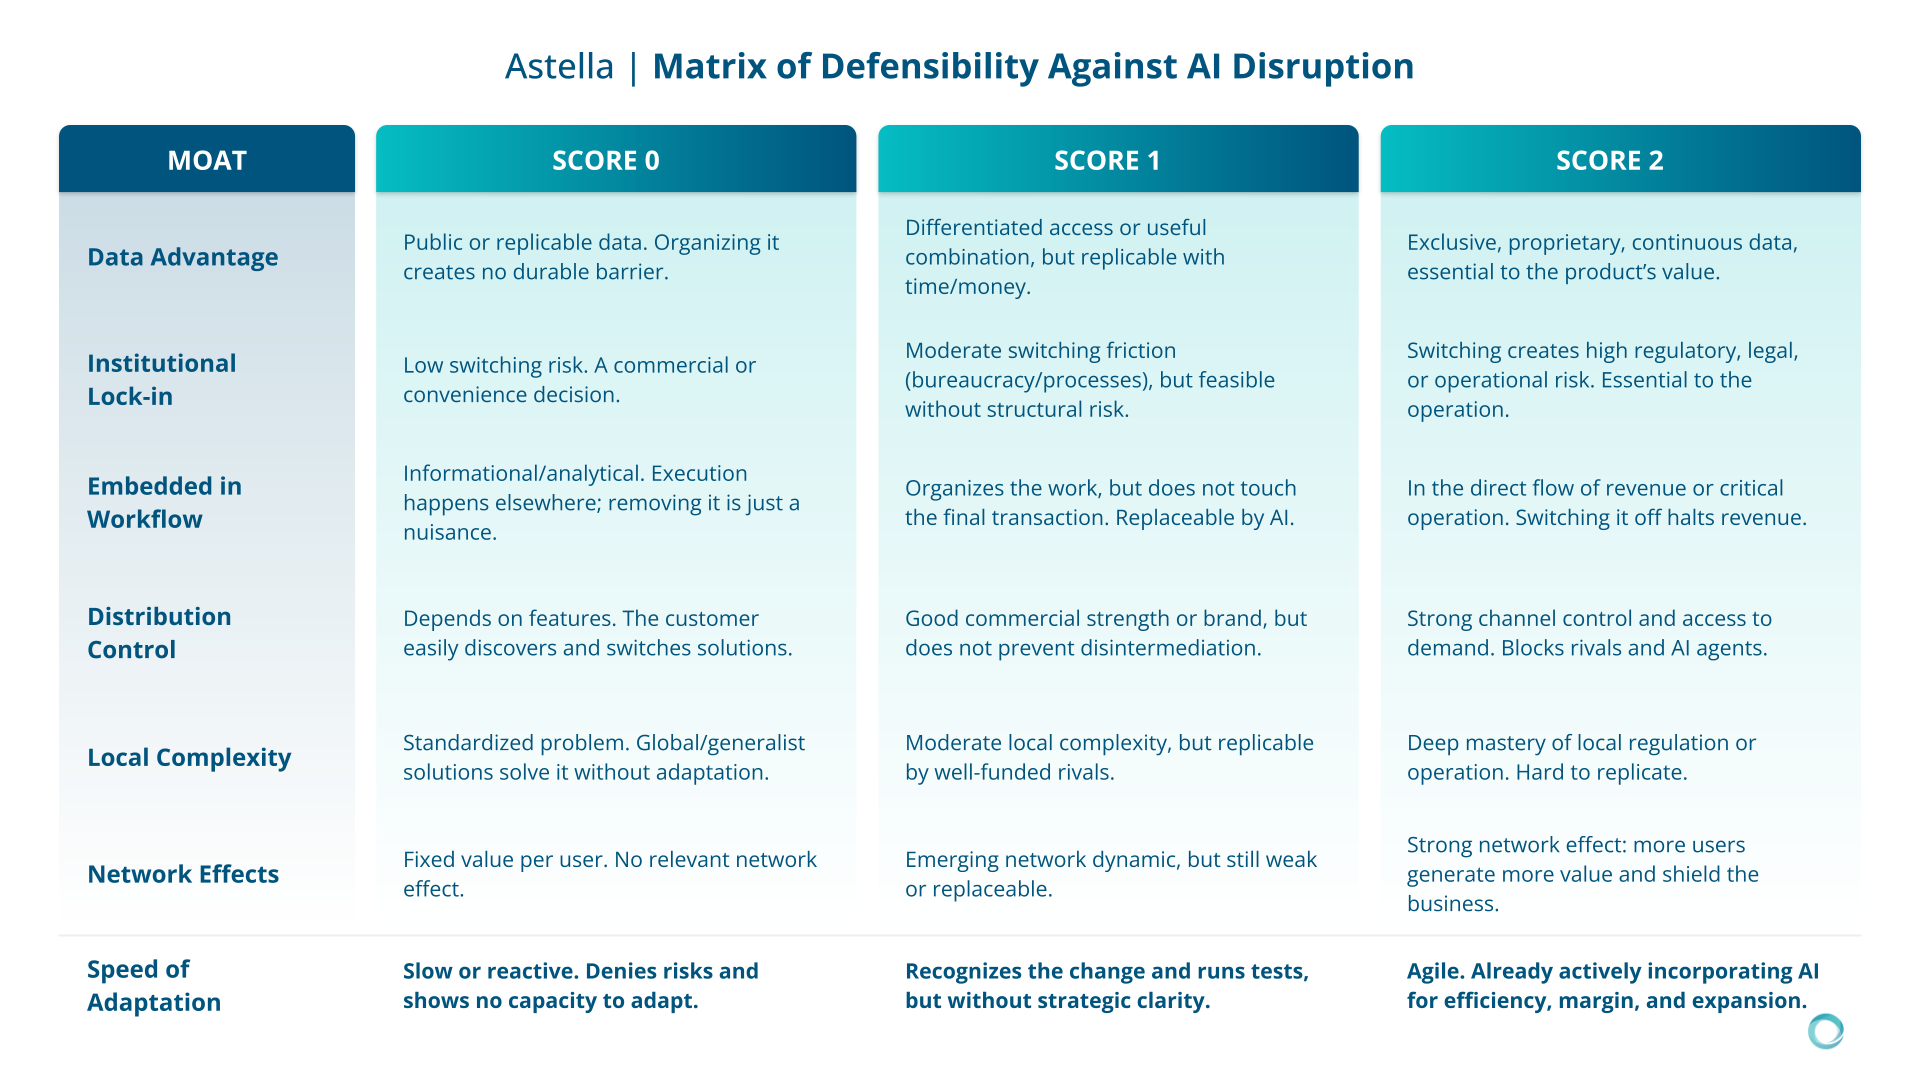
Our AI framework starts from an assessment of the classic competitive advantages, the moats, which have not disappeared but need to be requalified through the lens of Artificial Intelligence. Moving away from guesswork, we set out to map where the defenses and opportunities of this era lie, demystifying the alarms around the death of SaaS. The matrix has seven criteria, which lead us to a scoring that indicates the business's degree of exposure.
The seven criteria
Data Advantage
LLMs are trained on practically everything that is open on the internet and can query the web in real time when integrated with the right tools. If a product depends exclusively on organizing public data, or data that is easily accessible or purchasable, it is highly exposed. An increasingly relevant advantage lies in what a16z has dubbed Walled Gardens — datasets that are proprietary, regulated, and/or dynamically updated.
The top score goes to companies that hold exclusive, permissioned data, or data generated by their own operation, which is hard to replicate and improves the product, decision, or outcome delivered to the customer.
Institutional Lock-in
With migrations between software becoming easier, aided by agents, we are seeing a reduction in purely technological lock-in.
This pillar measures whether the level of friction caused by switching solutions creates regulatory, legal, operational, or compliance risk for the customer. Companies embedded in processes that demand traceability, trust, and institutional robustness are structurally harder to replace. Regulatory compliance software, for example, carries a switching and conformity cost that goes beyond the price of the license.
Embedded in Transaction/Workflow
The level of embedment assesses how inseparable the product is from the customer's critical operation. If it acts merely as an analytical or informational dashboard, it is vulnerable, and replacing it generates, at most, a temporary operational nuisance.
True resilience lies in transactional solutions, such as systems that process payments, settle orders, or issue mandatory tax documents. When the product is the company's financial or physical rail, switching it off halts revenue at minute zero. The closer it sits to the backing of the transaction or the core workflow, the greater its defense.
Distribution Control
Artificial intelligence changes the cost of building a product, but it does not eliminate the challenges of distribution and acquisition. This pillar assesses whether the company controls access to demand and to the decision-maker (the buyer) in a way that makes it hard to disintermediate the relationship.
If acquisition and retention of a solution depend purely on features, the customer can discover and adopt an automated alternative with relative ease.
Conversely, if the company has built exclusive channels, brand trust, authority, or a close relationship that makes it the natural path of consumption, its position enjoys greater protection.
In other words, distribution through proprietary channels increasingly becomes a moat.
Local Complexity
Foundational models are generally designed to be excellent generalists. Yet they often run into difficulties in processes that require navigating local frictions, specific legislation, and cultural particularities — what we can call sharp edge problems. They would have the capability, but they are focused on broader use cases with larger market sizes.
A company that masters a deep layer of bureaucracy or constantly changing tax rules — tax and fiscal software, for example — requires constant updating and specific knowledge. This real-world friction, which has always represented a challenge for product expansion, is for now still a defense.
Network Effects
At moments of accelerated innovation, it is common to confuse rapid growth of the user base with a true network effect. A product that delivers essentially the same value regardless of whether it has one or a thousand customers operating simultaneously has no real network effects.
Strength in this criterion materializes when the entry of each new participant (whether users, suppliers, or partner ecosystems) makes the network more valuable for all the other nodes.
Speed of Adaptation
This is a shifting criterion with a behavioral bias, acting as a marker across the assessment bands. The structural advantages cited above protect companies' operations in the short and medium term, regardless of who runs them. However, inertia at moments of technological inflection tends to be decisive.
That is why the matrix assesses a seventh pillar of a dynamic nature: management's capacity and speed of adaptation. It measures leadership's dexterity in not just recognizing disruption, but acting quickly, incorporating the advances of AI at every level of the organization. After all, most of the companies that exist today, right now, are incumbents.
The principle behind the scoring and calculation
Now let's understand the analytical premise of the assessment. A company that shows middling performance across all fronts is fundamentally different from a business that has strong defenses in two or three pillars, even if both arrive mathematically at the same numerical score.
This distinction matters to the framework, because a collection of reasonable attributes does not constitute a real competitive moat; under strong competitive pressure, these partial defenses tend to dissolve simultaneously. For a business to secure its perpetuity, it cannot depend on a fragile balance. It must build anchor points, structural supporting pillars that protect the operation even when other fronts of the company are challenged.
This principle of concentrated resilience guides the calculation mechanics. The matrix score is the sum of the ratings across the six criteria (ranging from 0 to 12), and the company's final classification is determined by the intersection of two dimensions: the total score and the presence of criteria with the maximum rating (a score of 2, which we consider strong moats).
From this math, we can divide businesses into three bands of risk exposure:
- Most protected: Score of 8 to 12, necessarily requiring at least one strong moat (rating of 2). These are companies that orchestrate multiple defenses and have at least one truly solid structural pillar.
- Medium risk: Score of 4 to 7, regardless of the number of strong defenses, or a score of 8 to 12 but without any strong moat (rating of 2).
- At risk: Score of 0 to 3. Reflects businesses that present few or no relevant structural defenses.
As we mentioned earlier, the last criterion, which we call Speed of Adaptation, acts as an edge adjustment across these bands.
For example, an organization at the lower limit of medium risk (score of 4) that shows slow adaptation (rating of 0) is downgraded to "At risk." Conversely, a company at the upper limit (score of 7) that already has at least one strong moat and demonstrates fast adaptation (rating of 2) is classified as "Most protected." In all other scenarios, the original classification prevails without further adjustments.
Beyond the score, and how to use the framework
The true value of the matrix does not lie in the final classification itself, but in being a starting point to provoke deeper conversations.
The scoring is not a value judgment about the quality of the company, but a lens designed to transform the discussion about exposure risk — often laden with intuition and anxiety — into a tangible and objective analysis.
In this process, the biggest trap for any leadership is giving in to the forced rating, taking shelter in the comfortable "we're a 1, almost a 2." When in doubt between two ratings, the lower one is usually the more realistic for guiding strategy.
Two provocations help calibrate this view pragmatically:
- If a competitor operating natively with AI attacked your market tomorrow, which criteria of our framework would stop it from advancing? If no answer comes to mind with undeniable conviction, the warning sign is immediate.
- If your product evaporated today, would your customer lose critical history and institutional conformity, or just a convenience? The difference in the answers is what separates whether your software is part of a critical or transactional workflow, or is an illusory dependency.
After all, if with a generic model (and these are increasingly capable of absorbing complex contexts) the company gets 70% of the value of your product, perhaps it doesn't need your product.
Finally, we treat the framework as a living organism, and not as a static verdict. With the advance of LLMs and their capabilities to connect and interact with other systems, fortresses that seem unshakable today may be recalculated, while new frontiers of defense will emerge.
The current snapshot of the business is not a permanent map; it is the compass for continuous reassessment over the next decade of innovation.
A calculator to test the matrix on your business
Using the calculator below, you can analyze the current status of a company according to the criteria of the Matrix. At the end, you can save the score as a PDF, to discuss with the team and compare against later results.